
95th Bomb Group Casualties Analysis
Setting the Record Straight
Kevin “K5” Michels
Wing Historian
Commemorative Air Force, Gulf Coast Wing
B-17G Flying Fortress "Texas Raiders"
kevindmichels@gmail.com

Editor’s note: This article first appeared in the Commemorative Air Force Gulf Coast Wing newsletter in August 2021.
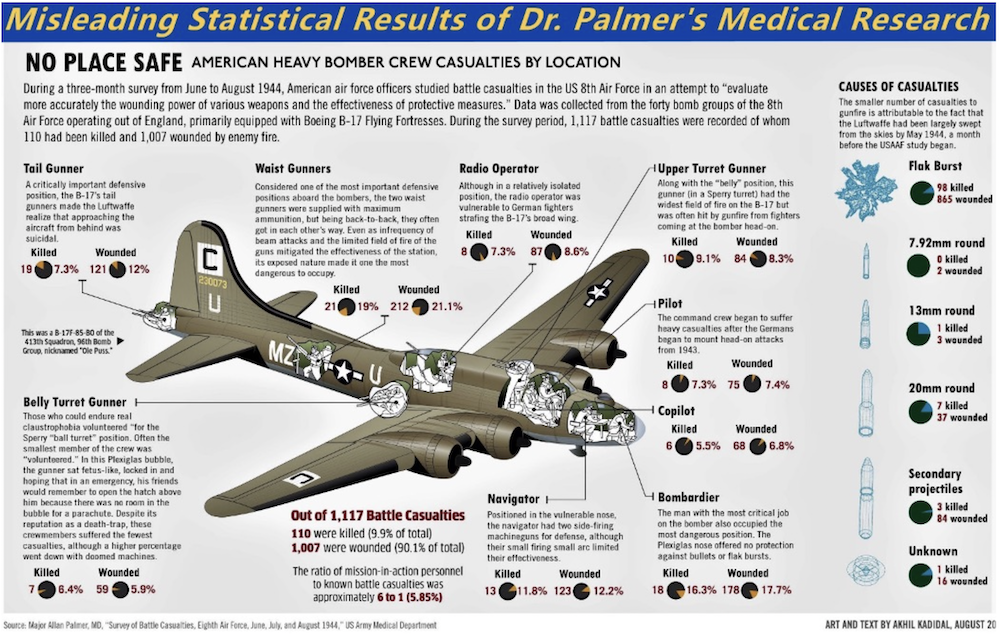
As is often the case, several months ago I found myself talking to Gerad Blume, Historian and Flying Fortress guru attached to Hangar Thirteen’s “Lucky 13” B-17 rebuild project. He and I talk often as he knows far more than I do on the minutiae of all things B-17. The subject this day was the commonly held misunderstanding of the Ball Turret Gunner being the “safest” crew position on board the plane. We agreed that it was a bit ironic that the root of this misunderstanding lay in what was otherwise the war’s finest statistical research analysis: Dr. Allan Palmer’s medical research work entitled “Survey of Battle Casualties, Eighth Air Force, June, July, and August 1944”. The 500-page work can be found in the “Wound Ballistics” volume of the “Medical Department, US Army in WWII” official history.
To the extent that you have come across data claiming the Ball Turret position was the “safest”, Dr. Palmer’s medical research work was the source, whether or not it was quoted as such.
Dr. Palmer’s Medical Research
Dr. Palmer’s research was groundbreaking and nothing short of incredible in its scope, depth, and usefulness to the US Army Medical Corp. The project was successful in its intention to better understand returning battle casualties in 8th AF heavy bombers and prepare the Medical Corp to better save lives. However, Dr. Palmer’s research was limited to casualties on returning aircraft only. Afterall, there was nothing the Medical Corp could do for aircrew that went down behind enemy lines. Any cursory view of WWII 8th AF casualties will show that most casualties were suffered on aircraft that failed to return to base. As such, Dr. Palmer’s data collection made no attempt to collect total casualty data. Therefore using Dr. Palmer’s report in postwar trivia discussions such as “which crew position was the safest” leads to unrealistic conclusions. In fact, if Dr. Palmer had known that future generations would attempt to draw conclusions of this nature with his data, he likely would have included bold-faced warnings to the contrary in every data table. As it was, Dr. Palmer had a job to do, he did it well, and the 500-page report is spectacular in its breadth, depth, and scope. But that scope was limited to the small percentage of casualties that returned from combat missions.
No other wartime analysis of combat casualties comes close to providing the level of minute detail of Dr. Palmer’s report. For instance, Dr. Palmer was able to determine within his study that just 14% of 8th AF casualties were caused by Luftwaffe fighters. The remaining 86% were caused by anti-aircraft fire (flak). And yet, it is easy to take that data out of context as well. Like the Ball Turret data, the Flak data is drawn from a three-month time period of June, July, and August 1944 from crews whose aircraft made it home. No data was available on aircrews lost in combat. As such, how much big picture statistical significance is that really providing?
Since the air war over Germany was constantly changing, it would be imprudent to make broad stroke conclusions about the Ball Turret Gunner or Flak casualties without obtaining additional data beyond the Summer of ‘44. Dr. Palmer’s Research deserves a full analysis of its own (beyond the scope of this article). For our purposes, the important limitations of Dr. Palmer’s data is listed so that the reader is aware before drawing conclusions beyond what the Medics needed to know:
1) Palmer’s data collection was limited: June, July, and August 1944 only. None before. None after.
2) Palmer’s data was collected from all forty 8th AF Bomb Group’s, which included B-24’s as well as B-17’s. Casualty data from B-17’s and B-24’s were intermixed with no regard for aircraft type, only position.
3) The 8th AF was in the process of reducing Waist Gunners from two per aircraft to one in the summer of ’44. Bomb Groups switched over independently as early as May or as late as August. As such, Dr. Palmer’s data included crews from aircraft that had either one or two Waist Gunners without making allowances for whether they were Left, Right, or Single. This made it impossible to determine relative risk against other positions.
4) Most 8th AF casualties were on aircraft that failed to return. Palmer collected data only from aircrews on aircraft that did return. This induced a dramatic “survivor bias” into the data.
According to the Army Air Forces Statistical Digest, the 8th AF suffered an overall KIA to WIA ratio of 2.4-to-1. By contrast, Dr. Palmer’s medical research data showed just the opposite with WIA outnumbering KIA by an incredible 9-to-1 ratio. Clearly, Dr. Palmer’s research, while quite useful and accurate for medical purposes, was completely out of touch with overall battle casualties.
Enter Gerad Blume and Russ Askey
As I was saying at the beginning of the article, I was lamenting to Gerad that I wished we had access to better detail data on 8th AF casualties. Something of greater breadth that covered a wider time period especially, but all I had ever seen were top level analysis that generally failed to answer the tough questions. That’s when Gerad said he had a complete listing of all individual casualties from the 95th Bomb Group received from one of their historians, Russ Askey. “No one has analyzed it though. The data is thorough, but raw, in Excel format. Would that be helpful?”
“Are you kidding?” I replied, “Excel and I are best friends! Send it right over.” Below is a sample of the 2,200+ datapoints in what turned out to be a researcher’s goldmine!

Historically helpful and even critical details that other BG databases seem to lack were all scrupulously detailed by Rod Hupp, Lead Researcher for the 95th BG Memorials Foundation. Casualty information was included from both returning and non-returning aircrews, which is very uncommon. All the data was fully cross-referenced as shown above. From this complete set of data, we can draw far more useful conclusions than would be possible from Dr. Palmer’s medical research.
All that was left was the analysis, which seemed simple enough at first, but was most certainly not! Ya’ll, I’m here to tell you I spent the better part of two months getting the analysis right. Below I have included what is just the tip of the iceberg so the article doesn’t get too long or bogged down in details. Anyone wishing to see the raw data and/or complete analysis, please let me know and I’ll happily send it your way.
Define “Casualty”
What the military means when it uses the word “casualties” may be different than a civilian’s understanding. Suppose a unit starts the day with 100 able bodied men, but at the end of the day’s combat operations has just 75 available. By definition, 25 casualties were suffered. A “casualty” is military parlance for “not available for duty”, but it does not necessarily mean KIA. Using “casualty” as a catch-all is an important and useful number for making all manner of military decisions. Casualties are usually suffered initially as killed in action (KIA), wounded (WIA), or Missing (MIA). Over time and with updated information an MIA status can be updated to captured by the enemy (POW), delayed, but returned home from friendly territory (RTD), evaded capture and returned home from enemy territory (EVD), or interned in a neutral country (INT). A final classification is killed in service (KIS). Whereas a KIA classification occurs as a result of death on a combat mission or enemy action, a KIS classification occurs as a result of death for any other reason.
95th Bomb Group Casualties Analysis - Intro
Given the robust data available, the stage is set for answering the type of historical trivia questions we ask today. "For the 95th BG, you will notice there are no MIA classifications left. After the end of the war, 177 MIA crewmembers were reclassified by the US government as KIA as no trace of them was ever found. The analysis below reflects their fates. You may also notice that the WIA numbers are small relative to other classifications. This is real and not a fluke. Relative to ground units, 8th AF bomber crewmen that suffered wounds were less likely to survive due in large part to the nature of air combat (extreme altitude, extended time before medical care, etc). Whereas the 95th BG data is very detailed, one level of detail not shown is the extent of any man’s particular injuries. As such, Dr. Palmer’s Medical Research is a far better place to glean that type of information.

There are many ways to analyze the data. The first is to simply add up all the casualty types and compare. Of the seven different classifications, it is clear that some are more significant than others. Clearly the “core group” of KIA, WIA, and POW should be the focus of the analysis. I decided that the RTD group could be left out, since those crewmen simply arrived home a little late and unharmed. Further, the EVD and INT groups were small, usually uninjured, and alive. So even though they often had some harrowing stories to tell, this group was likewise omitted from the primary analysis. I struggled with the KIS group, but ultimately decided to drop this classification since we are largely concerned with combat losses. Some may disagree with my approach, and for those the raw data is available for custom analysis.
Waist Gunners
In the summer of 1944 the 8th AF transitioned all heavy bombers from two Waist Gunners to just one. The 95th BG statisticians were good enough to list their Waist Gunners by RW, LW, and WG (when only one was aboard), so comparison is actually possible. For the record, the 95th BG switched to a single Waist Gunner at the beginning of August 1944. By contrast the 303rd BG switched in early May. Other BG’s switched throughout the summer. By September 1944, every B-17 and B-24 in the 8th AF carried just one Waist Gunner. As a sidenote, if you want to know when a specific Bomb Group switched over, the Missing Aircrew Records (MACR) database is an easy place to confirm it. Just pull up “downed aircraft by tail number” and check dates vs. number of Waist Gunners.
This leaves the question of “how do we compare the Left and Right Waist Gunners to other crewmembers during the changeover period?”. As it turns out, it is easy. The data only overlaps during Q3’44 and in the rollup totals. All other individual quarters are unaffected. For statistical comparison of Left, Right, and Single Waist Gunners to each other and to other crew positions, we simply add the Single Waist Gunner casualties to each of the Left & Right, since the Single Waist Gunner is taking on exactly half the risk of each of two Waist Gunners. In the final analysis you’ll notice that Waist Gunners statistically had the most dangerous overall position and that higher-than-average risk stayed consistent throughout the 95th BG’s combat tour.
Show Me the Data Already!
Looking at the “95th BG Casualties by Crew Position” graph you can see that casualty rates for any one position did not vary more than 10% from the mean. According to this analysis, the safest position was the Co-Pilot and the most dangerous was the Waist Gun position. Incidentally, the risk to the Ball Turret
Gunner was about average.Data shown is from May ’43 through Apr ’45 inclusive.

The next graph, “95th BG Casualties by Quarter”, looks at casualties over time.Since we’ve established that Dr. Allan Palmer’s data covering June, July, August 1944 (circled in Red) is not representative of the war, what does the 95th BG dataset tell us?

Except for Q1 ’44, it appears that casualties were on a slow, steady decline. That Q1’44 spike is real by the way, driven by the 8th AF’s targeting of the Luftwaffe on particularly dangerous and successful missions inside Germany. This included “Big Week” and the first strikes on Berlin. That effort paid dividends in the form of greatly reduced fighter resistance in subsequent quarters, but a tremendous price was paid by men and machines.
Shifting attention to the set of three graphs below, the 8th AF was growing rapidly over the course of the war and thus each BG was able to sortie more and more aircraft on assigned missions (See Left Graph). Whereas the percentage of damaged aircraft returning remained within a small range for most of the war, the percentage of aircraft lost continued to improve throughout the war (See Center Graph).
Given that data, calculating casualties per mission and casualties per aircraft (or sortie) was easy (See Right Graph).As you can see, the casualty risk for 95th BG crews was greatest at the beginning of the war, dropped dramatically through Q2’44 and then continued to improve marginally through the end of the war.

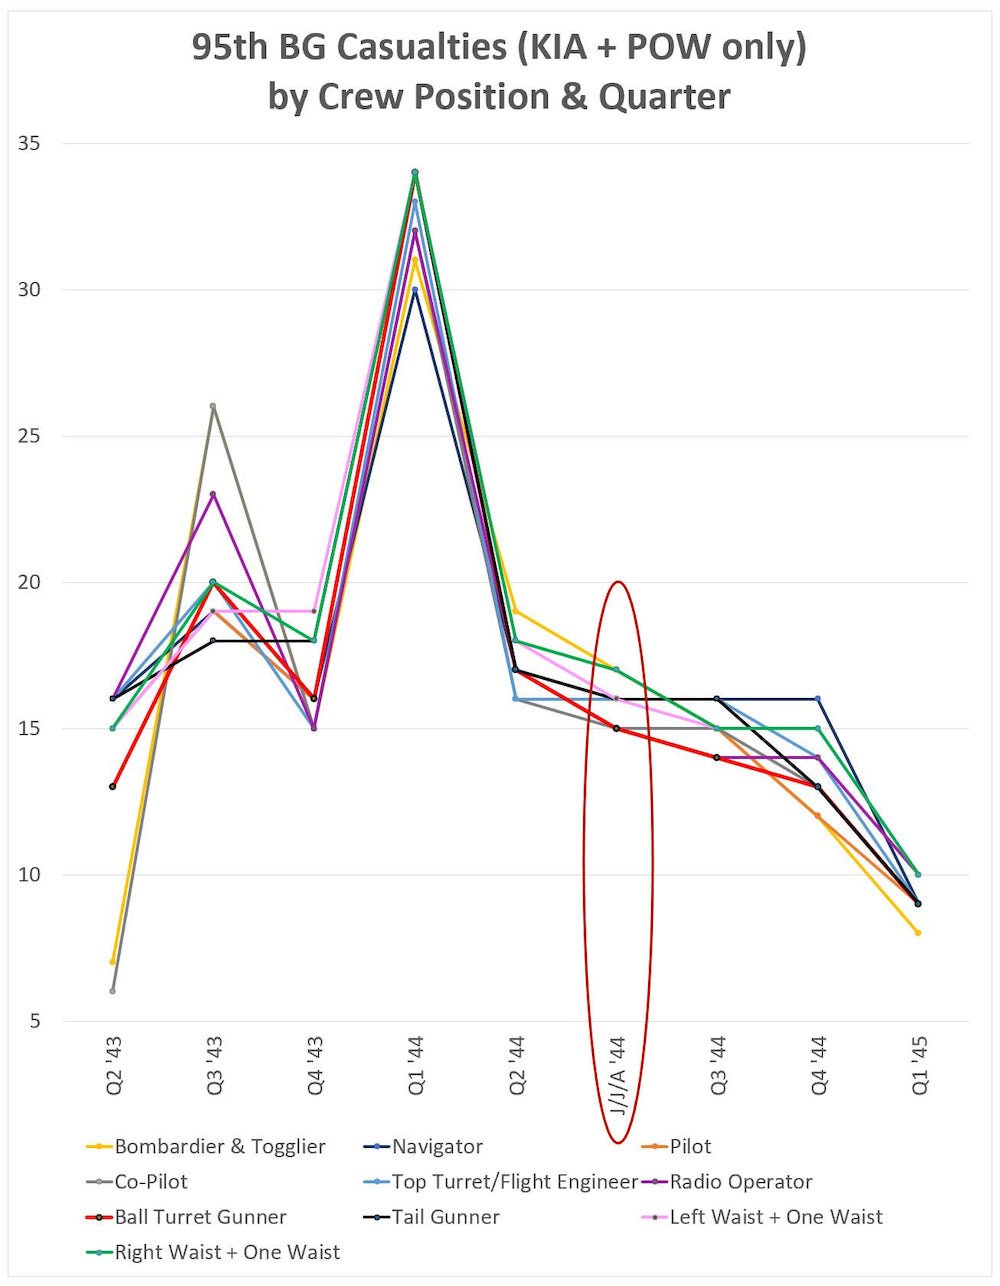
“95th BG Casualties by Crew Position & Quarter”, is a single graph with ten data lines, one for each crew position. I included only KIA and POW casualties here. As you can see, casualty rates varied a lot from quarter to quarter, but varied far less from crew position to crew position. Further, as the crisscrossing lines show, the crew position that held the title for “most dangerous” and “least dangerous” tended to change often.
Of note, you will see that in June, July, August 1944 the 95th BG title of “least dangerous” was indeed held the Ball Turret Gunner (concurring with Dr. Palmer’s medical research for the same time period). However, the Ball Turret Gunner only carried that “least dangerous” title for one of eight calendar quarters (Q3 1944). A quarter which overlaps most of Dr. Palmer’s research data. In Q1’44 the Ball Turret Gunner tied for the “most dangerous”. For all other quarters, the Ball Turret position carried an approximately average amount of risk.
Who Really Had the Safest and
Most Dangerous Positions?
This question is not as simple to answer as it once was, is it? The Ball Turret Gunner clearly was neither the safest nor the most dangerous. Given the time periods covered here, I’d say the Co-Pilot had the overall the safest position. But notice that during Q3’43 the Co-Pilot was tied for most dangerous position. We have no data available prior to May 1943 when the Luftwaffe was practicing Frontal Assault Tactics. Also note that the first flak jacket appeared in March 1943. Officers up front undoubtedly took much higher casualties during these early periods, but we don’t really know how high. All we have is the data available.
In summary, finding the “safest position” answer can be difficult since that answer clearly changed over time. The Waist Gunners, however, seemed to be consistently exposed to the highest danger.
Final Thoughts
The 95th Bomb Group data is far superior for historical analysis than Dr. Palmer’s medical research, but it is not perfect either. Whereas the 95th BG data is complete and provides all the pertinent data we “historical trivia question asking types” could want, there are two limitations:
1) There were 26 Bomb Groups flying B-17’s and 14 Bomb Groups flying B-24’s in the 8th AF. Of which the 95th was only one.
2) The 8th AF experienced 32 months of combat between August 1942 and April 1945. The 95th BG was in combat for just 23 months having their baptism of fire in May 1943. If we are using the 95th BG’s data as a proxy for the 8th AF, this leaves a nine-month gap without casualty data in a time period when there were a tremendous number of casualties.
Additionally, we have a total lack of casualty data from the 15th AF (Africa/Italy) and the 5th AF (SW Pacific). What I am confident of though is that the 95th BG data gives us much better insight than we have previously had available. If you are aware of helpful data from other BG’s, please contact me.
In closing, the analysis of the 95th BG data as presented here is my responsibility. I am confident in the data. I am confident in the analysis. I am proud of the information that I can present to you here but am also responsible for any unintentional errors. If you would like to review the data or analysis or even perform your own, please contact me and I will gladly send you what I have.